Third: Protecting range and sheets in Google Sheets

Take a look to an improved version of the SMILES2Spectra sheet here:
https://docs.google.com/spreadsheets/d/1DG9fTdSkDE_f2DqEIW0ib2HOlW6p-BQH0TMqZbJUYBE/copy
JCAMP-DX import is in Sheet3. The chart works only when the data is in XYDATA format (usually IR spectra). More work needs to be done to process peaks or points.
For those wondering the SMILES2spectra spreadsheet is here https://docs.google.com/spreadsheets/d/1iKEXWUk4JQQdueklu8-PFbg-b0GNHYC9hIvoywEOY4I/copy.
The expression that is the second argument of the IMPORTXML function is an XPath expression. XPath is a computer language to pull specific data from an XML expression. More information on XPath can be found at:
https://www.w3.org/TR/xpath/
https://www.w3schools.com/xml/xpath_intro.asp
https://www.tutorialspoint.com/xpath/index.htm
"//link[@rel='canonical']/@href" reads search for a "link" tag wherever in the page such as it has an attribute "rel" which equals "canonical" and pull the value of its "href" attribute.
For benzene, it will pull the value "https://chem.nlm.nih.gov/chemidplus/rn/71-43-2" from line 106 of view-source:https://chem.nlm.nih.gov/chemidplus/name/benzene.
Does it make sense?
Cheers,
Jordi

Maybe I should mention to everyone, if you type a name into cell B1, it brings up an IR/UVVis/MS spectra (dictated by cell A5), and a jdx of the data.
Is there anyway we can lock some cells on a spreadsheet, while leaving others open? The ideal would be to lock all cells but B1. Can that be done?
Cheers,
Bob
Hi All, I think I am addressing Jordi, although anyone is welcome to chime in.
I tweaked your spreadsheet smiles2spectra to name2spectra and it is here,
https://docs.google.com/spreadsheets/d/1EGfeOYLYWT-wM_cHMN8zxDT1WoltOnDSjWRfFg0B35g/copy
I have two questions,
First, in this code,
=MID(IMPORTXML("https://chem.nlm.nih.gov/chemidplus/name/" & B1,"//link[@rel='canonical']/@href"),40,60)
I do not understand what is happening after the "&B1&", and I want to make a video explaining what we are doing. Can you explain?
Second, in cell 24 I made a jab at getting the jdx. Any advice? I would like to download the spectral data as two columns, can we do that?
Cheers,
Bob
All, I have uploaded two files, one a PDF, the other in Excel, labeled 1-alkanols IR Gas Phase.
You need to log in to see these.
You will also see several other files,
-Nonylphenol Spectra.CDF is a GC-MS which we used OpenChrom to open
-three JDX files that we opened with Jmol (JspecView in the tools option)
-a large Chlorophyll a file in Excel, and we made a function in Excel that allowed us to pick two wavelengths and autogenerate the peak height ratios.
I will make Youtubes on how we did these shortly. I will also make a video on pulling spectral image files from NIST Webbook.
Cheers,
Bob
There is another simple viewer page at
http://wwwchem.uwimona.edu.jm/spectra/JSVdisplay.html
Here too you can drag and drop a file from the web or your local device or use the menus to file load a local file or from a URL

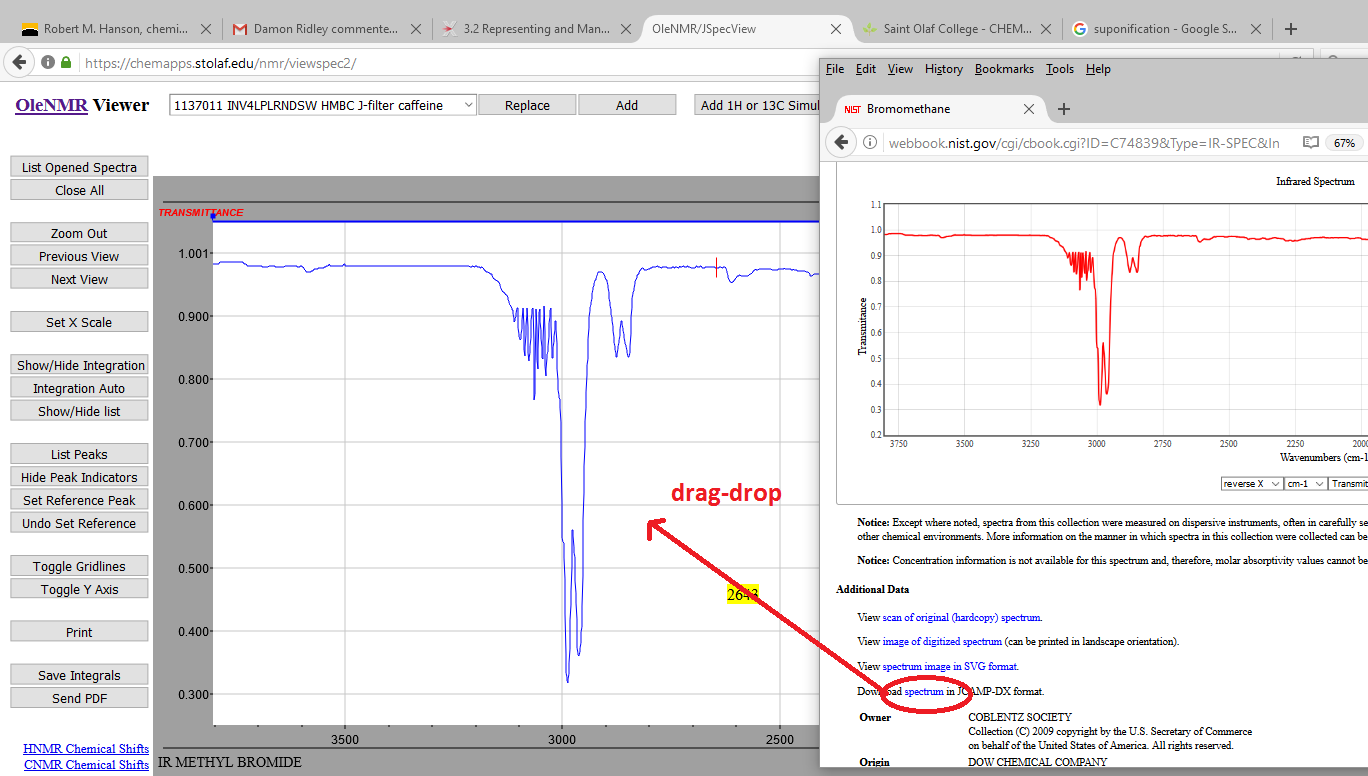
I thought I would also suggest a page here at St. Olaf that we use to work with data from our NMR spectrometer but can also load any JDX spectrum of any type (IR, Raman, UV/Vis, GC/MS, NMR, etc.) and also do both 13C and 1H NMR simulation. It is quite new and quite powerful. The easiest way to use it is to just drag-drop JDX files into it:
drag-dropping files into OleNMR
Once a spectrum is loaded you can call up a menu with a right-click to save it in all sorts of formats, including (decoded) simple x-y JDX format.

I don't that NIST has made a way for users to do that, although I have an email in to the creator to find out.
For now, Otis' solution looks like a good one...
UPDATE
So the creator of the WebBook just go back to me and indicated the following:
"As an approximation one could do a series of molecular weight searches specifying that you want an IR spectrum.
Presumably the lighter species are more likely to have a gas phase spectrum."
A solution, but not the easiest thing to do. This is a situation where you realize how useful well designed (flexible) websites are that allow the user to search how they want, not just how the creator intended...
Stuart

Bob
You can of course do this on Reaxys. For example I searched for 1-alkanols with the structure search ALH-C-O (As drawn) and in the IR Spectroscopy subfield (solvent) I entered the term: gas* . Then Search (Substances) gave an answer set with Hit Data (the rows of information that listed "gas" in the Solvent subfield). Then I Exported into Excel and obtained the 80-odd records.
I shall send the download to you by email and you can then upload it.
Damon
This canbe done using the Data/Protected sheets and range...
I would suggest protecting the sheet Sheet1 but the ranges B1:D1 and B2, by using a warning on edit.
Cheers,
Jordi