#bottomRepresenting & Managing Digital Spectra
Since the early 1970’s microcomputers (as they were called at the time) have been a huge part of the development of scientific instrumentation. As computer control of instrumentation became more prevalent, there was a need to also interface the detectors of instruments to the computer so that data (analog or digital) could be captured as it was generated, rather than output it on oscilloscope screens or chart recorders (see https://en.wikipedia.org/wiki/Chart_recorder).
In the early years of the digital capture of spectral data the main limitation was storage capacity. As a result there was a practical limit on the time resolution (points per minute) and signal resolution (how many bits an analog signal was digitized as – see https://en.wikipedia.org/wiki/Analog-to-digital_converter). It wasn’t until the early 1980’s and the advent of the 5 1/4“ floppy disk which initially stored an amazing ~100 kB (0.1 MB) of data, that scientists were easily able to collect and save digital spectra.
Today, instruments generate a vast amount of data and file sizes can be up to several GB each for certain techniques (e.g. GC-MS). This module describes some of the common file formats for spectral data, websites where you can obtain reliable spectral data, and software for viewing/simulating spectra.
Spectral File Formats
As there are many instrument vendors, there are many different file formats for spectral data. This approach was supported vendors who developed the instruments and software to operate them; thus, in order to go back and view spectra you need to use their proprietary software – which of course gets updated on a regular basis and generates revenue. However, the majority of software does have an export format for the data (and maybe some of the spectral metadata) that can be directly imported into Excel or other applications because this has been a need for users for many years. This is typically as Tab-Delimited Text (.txt file) or Comma Separate Variable (.csv file) files.
Over time many scientists have lamented (even complained) that it would be much better if all of the data collected on instruments were stored in a common format that would make it easy to view and share data. While .txt and .csv files can be used for both activities, there has always been a need for a file format that supports both the spectral data and the associated metadata that describes the instrument type and settings, samples, analyte(s) and any other contextual information that gives the data value. Historically, this has been achieved using the following specifications (what are listed below are major specifications with formal standards – there are others that are less formally defined).
ANalytical Data Interchange (ANDI)
This is for mass spectrometry and chromatography data and is described by the ASTM Standards E1947 – Mass Spectrometry (http://www.astm.org/Standards/E1947.htm) and E1947 – Chromatography (http://www.astm.org/Standards/E1948.htm). ANDI uses the Network Common Data Form (NetCDF) self-describing data format that is generically defined to store array-oriented scientific data (http://www.unidata.ucar.edu/software/netcdf/).
Crystallographic Information Framework (CIF)
Used for crystallographic data only. This format is less traditional in its data organization than other formats because it not only contains x-ray crystallography patterns but a large, and very well organized, array of metadata about the system under study. This text format is a fundamental standard in the discipline of crystallography and authors of new crystallographic work must provide data in this format to get their work published. (http://www.iucr.org/resources/cif)
The Joint Committee on Atomic and Molecular Physical Data – Data Exchange format (JCAMP-DX)
For UV/Visible Spectrophotometry, Infrared, Mass Spectrometry, Nuclear Magnetic Resonance, and Electron Spin Resonance data. JCAMP-DX is currently administered by the International Union of Pure and Applied Chemistry (IUPAC) at http://www.jcamp-dx.org, although the format has not been actively updated in almost 10 years. Although JCAMP-DX has not formally been standardized, it is currently the de facto standard for sharing spectral data and all the major databases store their data in the format.
JCAMP-DX is a file specification consisting of a number of LABELLED-DATA-RECORDs or LDRs. These are defined to allow reporting of spectral metadata and raw/processed instrument data. The table below outlines some of the main LDRs in JCAMP-DX.
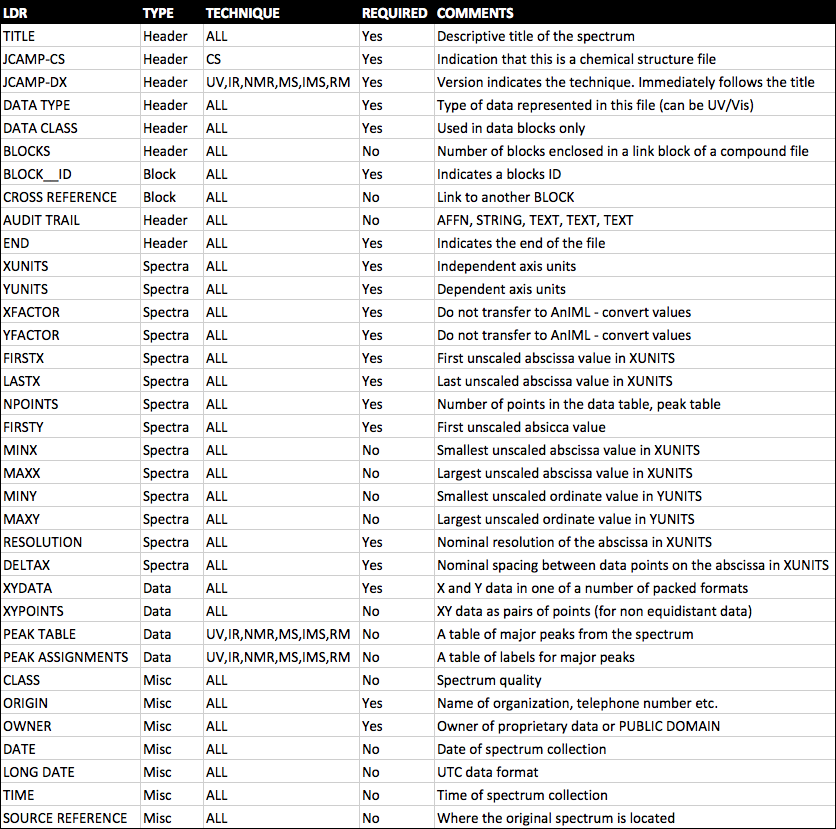
An example JCAMP-DX file is shown below.
##TITLE= Cholesterol (pktab1.jdx)
##JCAMP-DX= 5 $$home made
##DATA TYPE= MASS SPECTRUM
##DATA CLASS= PEAK TABLE
##ORIGIN= Dept of Chem, UWI, Mona, JAMAICA
##OWNER= public domain
##$URL= http://wwwchem.uwimona.edu.jm:1104/spectra/testdata/index.html
##SPECTROMETER/DATA SYSTEM= Finnigan
##INSTRUMENTAL PARAMETERS= LOW RESOLUTION
##.SPECTROMETER TYPE= TRAP
##.INLET= GC
##.IONIZATION MODE= EI+
##XUNITS= m/z
##YUNITS= relative abundance
##XFACTOR= 1
##YFACTOR= 1
##FIRSTX= 0
##LASTX= 386
##NPOINTS= 46
##FIRSTY= 0
##PEAK TABLE= (XY..XY)
0,0
41,520 43,1000 55,630 67,417 69,404 79,544 81,906 91,685 95,772 105,801
107,685 119,439 121,515 133,468 135,461 145,760 147,571 159,529 161,386
173,249 185,150 187,149 199,216 213,454 215,130 228,122 229,187 231,150
247,568 255,378 260,165 261,106 275,306 287,24 297,22 301,207 314,67
325,65 328,20 339,19 353,354 368,791 369,262 371,140 386,324
##END=
Note the LDRs for XFACTOR and YFACTOR. Although in the above example these LDRs are both 1 (because the raw data is already integers), these factors are commonly used to represent numeric values with a large number of decimal places as integers so that only one or two numbers (the factors) have to be stored as decimal values. This means that storage of rounded numbers is minimized and any error incurred because of rounding is applied evenly to all the data points. An example of data in this format is below.
##YFACTOR= 9.5367E-7
…
##XYDATA= (X++(Y..Y))
4400 68068800 68092800 68145600 68100800 68140800 68232000
4394 68304000 68316800 68195200 68152000 68182400 68176000
4388 68240000 68252800 68156800 68156800 68236800 68292800
4382 68302400 68265600 68233600 68214400 68224000 68284800
4376 68353600 68334400 68219200 68230400 68315200 68276800
4370 68259200 68264000 68257600 68316800 68292800 68339200
The data in a JCAMP-DX file can be all be compressed using a number of different human readable compression formats. This capability was added in order that spectral files were not to large for the storage media available (see above). There are four formats for compression, called ASCII Squeezed Difference Format (ASDF) outlined in one of the original articles on the JCAMP-DX format (http://old.iupac.org/jcamp/protocols/dxir01.pdf). These are listed below and use the letters as pseudo-digits.
|
Pseudo-digits for ASDF Formats |
|
|
1. ASCII digits |
0 1 2 3 4 5 6 7 8 9 |
|
2. Positive SQZ digits |
@ A B C D E F G H I |
|
3. Negative SQZ digits |
a b c d e f g h i |
|
4. Positive DIF digits |
% J K L M N O P Q R |
|
5. Negative DIF digits |
j k I m n o p q r |
|
6. Positive DUP digits |
S T U V W X Y Z s |
Note: The above characters replace the leading digit, sign, and preceding space for SQZ, DIF, and DUP forms.
The remaining digits of a multi-digit number are standard ASCII.
|
Simple Examples of ASDF Formats |
|
|
FIX Form: (22 chars) |
1 2 3 3 2 1 0 -1 -2 -3 |
|
PAC Form: (19 chars) or: |
1+2+3+3+2+1+0-1-2-3 1 2 3 3 2 1 0-1-2-3 |
|
SQZ Form: (10 chars) |
1BCCBA@abc |
|
DIF Form: (10 chars) |
1JJ%jjjjjj |
|
DIFDUP Form: (7 chars) |
1JT%jX |
As can be seen, the best compression is obtained by using the DIFDUP format which results in a 22/7 or 3.14x compression of the data. However, this is not always the amount of compression that will get because it depends on how variable the data points are in the file and it is important to choose the right format to get the best compression.
In addition to these existing formats there are a couple of newer formats that will eventually replace the JCAMP-DX specification.
Analytical Information Markup Language (AnIML)
For all spectral data. AnIML is an eXtensible Markup Language (XML) format for storing instrument data and metadata under development since 2004 (http://animl.sourceforge.net). The specification is being coordinated under the American Standards and Testing of Materials (ASTM) E13.15 committee on analytical data.
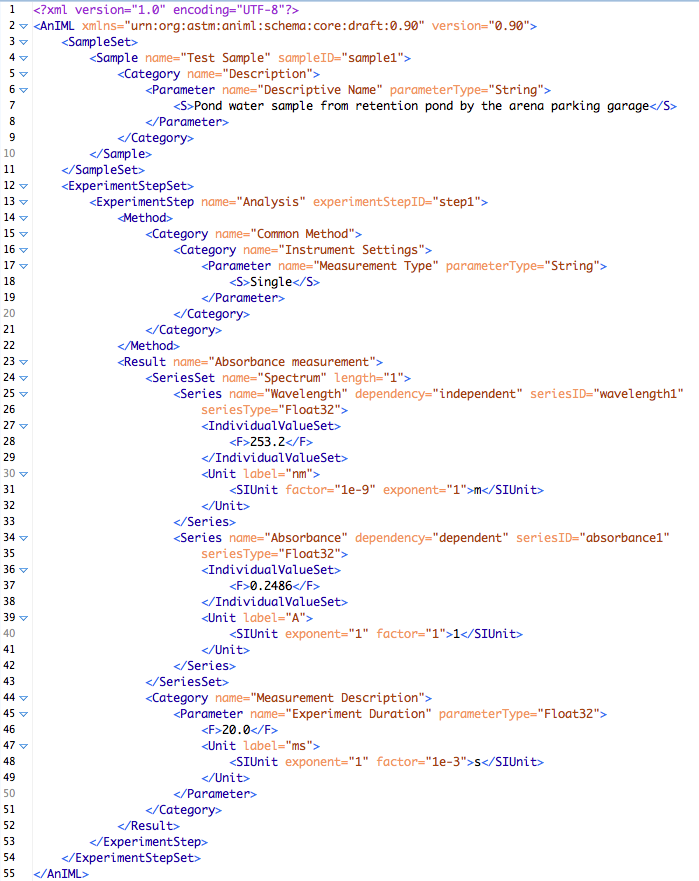
It was recognized in 2004 that there needed to be a successor to JCAMP-DX because of i) advances in technology, ii) a recognized need to represent data from all analytical techniques, and iii) issues with variants of JCAMP-DX that made interoperability of the files difficult. AnIML files consist of up to four data sections; SampleSet, ExperimentStepSet, AuditTrailEntrySet, and SignatureSet. By design very little data/metadata is required so that legacy data, which may not have much or any metadata to describe it, can be stored in the AnIML format. An example ‘minimum’ AnIML file is shown below:
Allotrope Document Format
For all analytical data. The Allotrope Foundation was formed in 2012 from seven (now twelve) pharma companies around the notion of changing instrument data standards so that they were uniform across all instrument vendors. Three years later, Allotrope has just made available the first version of the Allotrope Document Format (ADF) that is based on the HD5 format for managing and storing data (https://www.hdfgroup.org/HDF5/). The ADF format stores data and metadata from the entire laboratory process (not just the instrument data) and is arrange in layers for metadata (using controlled vocabularies and ontologies), data, and linked files. The specification is so new that it has not yet been released to the community, but should be out by the end of the year. See http://www.allotrope.org.
Other spectral file formats
Lists of file formats for the following analytical techniques can be found at
- Mass Spectrometry - https://en.wikipedia.org/wiki/Mass_spectrometry_data_format
- NMR - https://en.wikipedia.org/wiki/Nuclear_magnetic_resonance_spectra_database
Sources of Spectral Data
AIST Spectral Database for Organic Compounds (SDBS) - http://sdbs.db.aist.go.jp
This database from Japan has a wealth of spectral information and is the best for searching, as there are many options to find what you need. Sadly, the majority of the spectra are presented as image files only (no JCAMP-DX) with only numeric peak data for MS and 1-NMR spectra (click the ‘peak data’ button. Currently, the site has the following amounts of spectral data:
- MS: ~25000 spectra
- 1H NMR: ~15900 spectra
- 13C NMR: ~14200 spectra
- FT-IR: ~54100 spectra
- Raman: ~3500 spectra
- ESR: ~2000 spectra
NIST Chemistry Webbook - http://webbook.nist.gov/chemistry/
The NIST Webbook is a prime source of spectral information about small organic compounds available as JCAMP-DX files, Scalable Vector Graphic (SVG - http://www.w3.org/Graphics/SVG/) files (an image format specified in XML), png image files, and scans of the original data (some from the 1960s). Searching for spectra on the site is done via the compound search and selection of the spectral data to be returned (if it is available for the compound(s) found). Other information such as thermodynamic property data, gas chromatograms (linked to original journal papers), and vibrational and electronic energy levels is also available on the site. Currently, the site has the following of spectral data:
- IR spectra for over 16,000 compounds
- Mass spectra for over 33,000 compounds
- UV/Vis spectra for over 1600 compounds
ChemSpider - http://www.chemspider.com
ChemSpider has over 10,000 spectra associated with chemical compounds in its database. Some of these are from commercial companies and organizations, but a large number have been uploaded by users of the website. As a result there may be spectra for compounds that are not available elsewhere. Finding compounds that have spectra available is not easy to do and in fact you can only access this information via one of the sites API’s (see below), which you need to create an account (free) to use. Access the following URL to get an XML file that lists all current spectral data by entering your security token in the ‘token’ field, which can be found on the http://www.chemspider.com/UserProfile.aspx page once you login on the ChemSpider website.
http://www.chemspider.com/Spectra.asmx?op=GetAllSpectraInfo
You can also search for spectra using the other commands on the http://www.chemspider.com/Spectra.asmx page, and search the mass spectra using commands found in the MassSpecAPI page at http://www.chemspider.com/MassSpecAPI.asmx. For example to search for peaks in a mass spectrum of mass 1000 ± 0.1 you can go to (no token required):
http://www.chemspider.com/MassSpecAPI.asmx/SearchByMass2?mass=1000&range=0.1
Other Sources of Spectra
- NIST Atomic Spectra Database - http://www.nist.gov/pml/data/asd.cfm
- NIST Molecular Spectra Databases - http://www.nist.gov/pml/data/molspec.cfm
- NMR Shift DB - http://nmrshiftdb.nmr.uni-koeln.de/
- Human Metabolome Database - http://www.hmdb.ca
- EPA Emissions Measurement Center Spectral Database -http://www3.epa.gov/ttn/emc/ftir/index.html
- MassBank - http://www.massbank.jp/
- Romanian Database of Raman Spectroscopy - http://rdrs.uaic.ro/index.html
Software
Spectral Viewers
- Jmol with JSpecView - http://jmol.sourceforge.net/ - the best and most widely used online and offline spectral viewer. Browser plugin provides a lot of features for display of data and export in different formats (right mouse click the plugin to see options for viewing spectra and exporting data). Go to the links below to test out the functionality
http://chemapps.stolaf.edu/jmol/jsmol/jsv.htm - drag and drop spectra viewing or search for molecules and display simulated spectra
http://chemapps.stolaf.edu/jmol/jsmol/jsv_jme.htm - draw a molecule and get simulated
spectrum
http://chemapps.stolaf.edu/jmol/jsmol/jsv_predict2.htm - same as the previous page but with 3D representation of molecular structure
- JCAMP Viewer - http://pslc.uwsp.edu/Viewers.shtml - web page looks old but software has been updated recently
- Flot JCAMP Viewer - http://webbook.nist.gov/chemistry - get from any page with spectra – requires web server
- SpeckTackle Javascript Viewer - https://bitbucket.org/sbeisken/specktackle - new on the scene – requires web server
- OpenSpectralWorks - http://scanedit.sourceforge.net/
- SpekWin32 - http://effemm2.de/spekwin/index_en.html
- OpenChrom - https://www.openchrom.net/ - primarily for chromatographic data but good for mas spectrometry as well
- ACD/Labs NMR Processor - http://www.acdlabs.com/resources/freeware/nmr_proc/index.php - NMR Only
- MestreLabs MNova - http://mestrelab.com/software/mnova/ - NMR Only ($)
- ChemDoodle - https://www.chemdoodle.com/ - reads all JCAMP files ($)
Spectral Prediction
- nmrdb.org - http://www.nmrdb.org/
- NMR Shift DB Online - http://nmrshiftdb.nmr.uni-koeln.de/nmrshiftdb/
- ChemDoodle - https://web.chemdoodle.com/demos/simulate-nmr-and-ms/
- ACD/Labs iLabs - https://ilab.acdlabs.com/iLab2/ (limited online trial)
Spectral Assignment
- Go to the NIST WebBook and download the following spectra in JCAMP-DX format
- Mass spectra for each of the three isomers of nitrobenzoic acid
- Gas phase IR spectra for each of the three isomers of nitroaniline
- Go to ChemSpider and download the HNMR spectra of the three isomers of xylene in JCAMP-DX (can you find them?)
- Go to the first JSpecView page above or download the JCAMP Viewer software for your OS. Import each of the spectra into the viewer you choose and export them to X,Y format.
- Finally, import each of the X,Y data files into Excel with one sheet for the MS data, one sheet for the IR data, and another sheet for the NMR data. Plot the three IR spectra on one graph (so they are overlaid) and do the same for the MS and NMR data (so you end up with three graphs). Save the file.
- Write a short paragraph comparing/contrasting for each of the three plots of overlaid IR, MS, and NMR spectra.
Comments 13
Gas phase IR Spectra
I am trying to find out the gas phase IR spectra of some organic compound on NIST webbook but I am unable to do that. Can anybody tell me how to get IR spectra from NIST webbook?
Amita
Gas phase IR Spectra
Amita,
Have you tried Reaxys? If from the home (entry) page you enter: ir spectroscopy ofthen click Enter/Search you should get an answer set: Substances. Click View Results and then Hit Data and you should go directly to the IR records.
However, this depends on whether you know a trivial name that Reaxys recognises for the substance.
Reaxys also has a specific subfield for gas phase IR spectra, but there are very few substances listed in this subfield.
Let me know how you get on. If you don't have any success, then please get back to me and let me know the substance in which you are interested.
Damon
More resources the better!
Hi Amita,
Please do use Reaxys, and as many other resources as you can find, as the more you know of what is out there, the better.
Stuart may be able to better explain this, but the Webbook does not appear to be indexed by spectra, but by compound, so using the name/formula/identifier options opens a page, like this one for chemical name, http://webbook.nist.gov/chemistry/name-ser.html. and click the appropriate radio button.
I do not know how one would get a list of compounds for which there are specific spectra for, which would be a nice thing to know. Does anyone know how to do that.
But also try other resources, and learn what is out there.
Cheers,
Bob
List of spectra
Bob
You can of course do this on Reaxys. For example I searched for 1-alkanols with the structure search ALH-C-O (As drawn) and in the IR Spectroscopy subfield (solvent) I entered the term: gas* Then Search (Substances) gave an answer set with Hit Data (the rows of information that listed "gas" in the Solvent subfield. Then I Exported into Excel and obtained the 80-odd records.
I shall send the download to you by email and you can then upload it.
Damon
List of spectra
Bob
You can of course do this on Reaxys. For example I searched for 1-alkanols with the structure search ALH-C-O (As drawn) and in the IR Spectroscopy subfield (solvent) I entered the term: gas* . Then Search (Substances) gave an answer set with Hit Data (the rows of information that listed "gas" in the Solvent subfield). Then I Exported into Excel and obtained the 80-odd records.
I shall send the download to you by email and you can then upload it.
Damon
Uploaded files
All, I have uploaded two files, one a PDF, the other in Excel, labeled 1-alkanols IR Gas Phase.
You need to log in to see these.
You will also see several other files,
-Nonylphenol Spectra.CDF is a GC-MS which we used OpenChrom to open
-three JDX files that we opened with Jmol (JspecView in the tools option)
-a large Chlorophyll a file in Excel, and we made a function in Excel that allowed us to pick two wavelengths and autogenerate the peak height ratios.
I will make Youtubes on how we did these shortly. I will also make a video on pulling spectral image files from NIST Webbook.
Cheers,
Bob
Webbook
Amita,
You can also go directly the Webbook search page:
http://webbook.nist.gov/chemistry/
But here’s some fun: Google does a pretty good job of indexing InChI for Webbook. Here’s an advanced Google Search URL to search Webbook IR images directly:
https://www.google.com/search?as_st=y&tbm=isch&as_q=&as_epq=1S/CH4/h1H4&as_oq=infrared+mass+uv+visible&as_eq=&cr=countryUS&as_sitesearch=webbook.nist.gov&safe=images&tbs=ctr:countryUS,isz:m,iar:w,ift:png
That URL is long! Make sure you copy the entire URL. Let me know if you have a problem. I can get you to this URL another way.
Don’t forget that the Webbook is only a subset of NIST’s more complete holdings.
That would be a nice feature...
I don't that NIST has made a way for users to do that, although I have an email in to the creator to find out.
For now, Otis' solution looks like a good one...
UPDATE
So the creator of the WebBook just go back to me and indicated the following:
"As an approximation one could do a series of molecular weight searches specifying that you want an IR spectrum.
Presumably the lighter species are more likely to have a gas phase spectrum."
A solution, but not the easiest thing to do. This is a situation where you realize how useful well designed (flexible) websites are that allow the user to search how they want, not just how the creator intended...
Stuart
JSpecView/OleNMR Spectrum Viewer web page
I thought I would also suggest a page here at St. Olaf that we use to work with data from our NMR spectrometer but can also load any JDX spectrum of any type (IR, Raman, UV/Vis, GC/MS, NMR, etc.) and also do both 13C and 1H NMR simulation. It is quite new and quite powerful. The easiest way to use it is to just drag-drop JDX files into it:
OleNMR Spectral Viewer
drag-dropping files into OleNMR
Once a spectrum is loaded you can call up a menu with a right-click to save it in all sorts of formats, including (decoded) simple x-y JDX format.
Spectra Viewer page
There is another simple viewer page at
http://wwwchem.uwimona.edu.jm/spectra/JSVdisplay.html
Here too you can drag and drop a file from the web or your local device or use the menus to file load a local file or from a URL
Thank you all for your
Thank you all for your valuable suggestion.
Data Extraction Methods
I recently read an article while doing background reading on some topics mentioned in this module and it was titled "Web Scraping vs API" and it listed several reasons for why the author seems to think the web scraping is often a better way to get data.
With extracting chemical data and using a site that can be used by both methods or at least one where the html is organized nicely and it offers web APIs for most of the data, which method would you recommend if setting up scripts for pulling data for long term use?
The url for the article I read is below
https://www.grepsr.com/web-scraping-vs-api/
scraping vs API
I would say scraping is hacking. To a certain extent it depends upon the site. Perhaps the authors intend for people to parse their page for information. But more likely they don't intend that, and they certainly do not feel obliged to keep their presentation format stable and never upgrade. Here are some reasons to avoid scraping wherever there is an API alternative:
-- might work today; no guarantee it will work tomorrow.
-- HTML pages are not designed to be used this way. They are designed with presentation in mind, not data retrieval.
-- APIs are designed for data retrieval.
-- APIs have publicly defined structure, which provides some aspect of stability.
-- HTML pages may appear differently on different platforms; APIs do not even have the sense of "platform"
-- When a web service provides an API, they intend for people to use it instead of scraping. You can contact a web service and ask them about their API, suggest improvements, point out issues. If you try that with their web page, and they have an API, they will just smile and say, "Please use our API." or maybe just dismiss you as a hack.
-- Consider the source of that blog. Do they have an agenda, perhaps?
So clearly I disagree with just about every point this blogger is saying.