Learning Objectives
- Understand the principles behind connection table representation of chemical structures
- Translate structural formulas into simplified connection tables and vice-versa
- Recognize the parts of a MOL file, a common connection table file format
- Map the correspondence between features of a structural formula and entries in a MOL file
- Adjust connection tables to make simple modifications to chemical structures
- Track how changes in a chemical sketch program and the underlying connection table data relate to each other.
Table of Contents
2.2.1. Introduction to Connection Tables
Connection Tables: Background
Before we dig into how connection tables work, it’s useful to know a little bit about where they came from. An early version of the connection table was developed by the scientific information specialist Calvin Mooers as a purposefully ineffective form of chemical representation. Mooers argued that explicit tabular representations of every atom and bond in a structural formula were not very good for either machine handling (too large and difficult to parse) or communication (too difficult to read). Ironically, the development of hardware changed this calculus and the table form is quite amenable to parsing. However, it’s useful to keep in mind that from the beginning, the virtue of connection tables was not their amenability to computation or to human interpretation, but the precision and explicitness with which they expressed chemical information.
Lesson 1: Connection tables were first and foremost about expressing chemically-meaningful information as extensively and explicitly as possible, which makes them ideal for informatics and other computing purposes.
Connection tables were first put to use in information systems at DuPont in the early 1960s. DuPont had **a lot** of chemicals and chemical information to keep track of across many divisions of the company. The connection table could be encoded by clerical workers rather than trained chemists, thereby saving company resources. One worker could number atoms (arbitrarily) and write down lists of atoms and bonds, and another worker could keypunch that list onto a punched card. Unlike systematic nomenclature or line notation, connection tables could be handled by workers who had little or no chemistry training.
Lesson 2: Connection tables express a lot of chemical information, but people without a lot of chemical training (but with the help of software) can create and work with them.
Chemical Abstracts Service partnered with DuPont to develop the connection table in the mid-1960s. CAS was in the midst of developing the Registry: a computer-based index of all compounds referred to in the literature. One part of the Registry system was the Registry Number, a record number for each compound or substance reported, in any context; the other half was the connection table, a general approach to chemical structure and relationships tied to each registry number, that related all of the compounds in the Registry structurally to one another.
Lesson 3: Connection tables were originally developed for the primary purpose of recordkeeping within a very large, but contained chemical data bank.
These three lessons are useful to keep in mind as you delve into cheminformatics:
- Don’t expect connection tables to be especially elegant or compact;
- Be alert for chemically naïve uses and results;
- Watch out for divergent conventions to start popping up when you deal with connection tables outside of well-defined and curated settings.
Perhaps most importantly, connection tables represent the machine part of human-machine interactions around chemical structures. Connection tables are applied in conjunction with database ID numbers, systematic names, and line notation that are designed for managing communication with humans. In order for connection tables and these various identifiers to serve their complementary purposes as well as possible (tracking structural relationships and locating specific compounds, respectively), we need reliable interfaces to connect these two forms of chemical representation.
As a starting point, this section will introduce a simplified form of connection table, which we’ll call an “SCT”. This SCT does not correspond directly to any existing file format (at least as far as we know!). Rather, it is a convenient model that we will use just for the purpose of this demonstration.
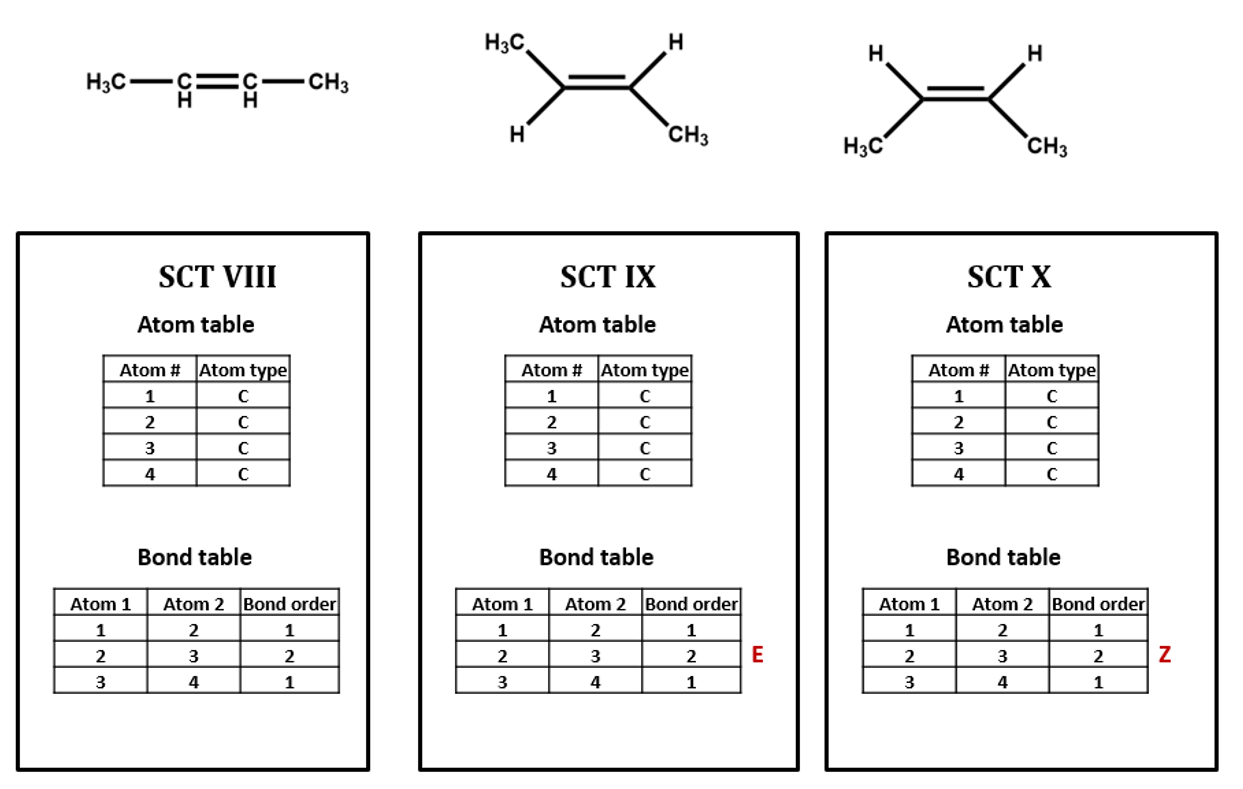
Like most connection table formats, our SCT is made up of two tables: an atom table and a bond table.
Our atom table will consist of two fields: one an index number identifying the atom we’re talking about, one indicating atom type (i.e. C, H, O, N, etc.).
Our bond table will consist of three fields: two indicating the two atoms that the bond connects, and one indicating the bond order (1=single, 2=double, 3=triple).
As an example, take isopropyl alcohol. SCT I is a connection table representing this compound – or, more specifically, representing this structural formula.

Connection tables are not necessarily unique
We could draw up other tables of atoms and bonds that represent this compound as well: for example, SCT II and SCT III. This is an important point: connection tables are not necessarily unique. Different tables can represent the same chemical structure. (Of course, there are many situations in which it is useful to have a unique connection table for each chemical structure. There are algorithms for selecting such preferred or “canonical” connection tables.)

Connection tables may treat H implicitly or explicitly
Note that, in SCT I, only non-hydrogen atoms are specified. This follows the common practice of simply assuming that an organic compound contains as much hydrogen as the rules of valence suggest that it ought to. Sometimes, however, hydrogen atoms are explicitly included in connection tables, as in SCT IV. Many databases do not show hydrogens in the visual structures that you see, but some include explicit hydrogens in the underlying connection tables while others do not. Unfortunately, it can be difficult to determine what type of connection table is in use, and this confusion can lead to all sorts of trouble.
Imagine searching for compounds by the number of atoms that they contain. Should you look for isopropyl alcohol among those compounds containing 4 atoms (implicit H) or 12 atoms (explicit H)? You might even have to look out for compounds containing 5 atoms (explicit hydroxyl H and implicit alkyl H). Depending on how confident you are about how your data is structured, you might need to design your search to handle all of these cases. When you are setting up a connection table format, if you have th choice, it's probably smartest either to make all H explicit or to make all H implicit.

Connection tables might deal ambiguously with stereochemistry
For our next set of examples, we’ll take a look at 2-butanol. We can form its connection table in just the same way as before (SCT V). However, the substituted carbon in 2-butanol is a stereocenter. We wouldn’t know that from the plain SCT, though one could infer this using a clever algorithm based on the rules for naming R/S isomers. Even if we as human viewers recognize that the compound is chiral and can draw in a dashed or wedged bond, there is no way to represent this within the bare-bones SCT atom and bond tables. We would need to add an additional field to the atom and/or bond table to handle chirality (SCT VI, VII). We could do so either in a chemically sophisticated way, annotating the atom property, in a chemically-naive translation of a diagram feature, annotating the bond configuration, or both.

The same goes for the E/Z configuration of a carbon-carbon double-bond. (SCT VIII, IX, X)
Delocalization and other phenomena
Connection tables are built to represent compounds atom by atom and bond by bond. Higher-order structural features that affect chemical behavior and identity – especially phenomena like electron delocalization and tautomerism – can be difficult to capture. For instance, SCT XI represents the benzene ring as three single bonds and three double bonds. Of course, so does the Kekulé structure in the structural formula, but it is a challenge to find such a pattern within a table, especially since the bonds in question might not show up in consecutive order, depending on how the table is put together. Even identifying functional groups within a connection table can be a tricky proposition. We will discuss this further below and in later units of this course.

Atom coordinates
Note that the SCT atom table does not tell you anything about the relative position of atoms. (As we have seen, you often have to go to the bond table just to figure out which atom is which.)
Many connection table formats contain two- or three-dimensional spatial coordinates for each atom entry. These coordinates may simply record the relative position of atoms in a structural formula sketched in a chemical drawing program (SCT XII).

They may also represent the calculated or measured three-dimensional positions of atoms. We will address atom coordinates in connection tables in more detail below.
1. Number each of the atoms in the structural formula for benzoic acid in SCT XI.
2. Write two different valid SCTs for each of structures a) - c).

3. Draw structural formulas for the compounds represented by SCTs a) – c).

4. Write a chemically-equivalent structural formula for 2a) that results in a non-equivalent SCT. Then, write that SCT.
- Log in to post comments
2.2.2. Anatomy of a MOL file
Most connection table formats contain one or more of the following:
- A list of atoms, specifying the elemental identity of each atom
- A list of bonds, specifying the atoms that it connects and the bond multiplicity (single, double, triple)
- 2D or 3D spatial coordinates for each atom (sometimes measured, sometimes calculated; often, it’s not clear which)
- Counts of the number of atoms and bonds in the molecule
- Attributes associated with atoms or bonds (e.g. R/S configuration of a stereocenter; dashed/wedged bond
- Attributes associated with an entire structure (e.g. net charge)
The MOL file, a widely-used chemical structure file format, contains all of these.
Here is a MOL file for benzoic acid, generated by ChemDraw, which provides options to save or to copy sketches in this file format.

The following figures illustrate the anatomy of a MOL file (MOL v2000, to be specific): the counts line, the atoms block, the bonds block, and the properties block.
Counts Block:

Atoms Block:

Bonds Block

Properties Block

Note that benzoic acid has nine atoms and nine bonds, not counting hydrogen. If all explicit hydrogen was included in this connection table, there would be six more entries in the atoms and bonds blocks, and the counts line would show fifteen atoms and fifteen bonds.
Multiple molecules
A connection table can represent multiple distinct compounds. Take a look at MOL II, phthalic acid.

We can represent the stoichiometrically equivalent phthalic anhydride plus water by keeping the same atom block and changing a couple of entries in the bonds block. Now, we have one connection table (MOL III) representing two molecules. (Connection tables can also be used in representing reactions. For more on this, see online documentation on MOL and related file formats.)
 Let's compare the bond tables of the above two files:

Tricky features
Working with connection tables can become tricky when it comes to features of chemical identity that are not directly represented as a static collection of atoms and covalent bonds, such as:
- Aromaticity and delocalization
- Tautomerism
- Coordination
Sometimes these phenomena are not (or even cannot be) represented in the connection table at all. Other times, different file formats (or different users of the same file format) will adopt different conventions for indicating them. This can make things tricky for those who want to manipulate chemical structure data across the tens of millions of known chemical compounds (and the limitless space of possible compounds). However, it also means that there are ample opportunities for developing clever cheminformatic solutions to the limitations of connection tables.
Few of these issues are likely to be solved completely. Think of the following examples, and the exercises that follow, as training in the sort of questions that you would be prudent to ask when it comes to working with digital data about chemical structures.
Aromaticity
Structural formulas I, IV, and V all representing the same molecule: benzoic acid. However, remember: connection tables are typically correspond to structural formulas on an atom-by-atom, bond-by-bond level, not on a holistic level. Since these are three different patterns of atoms and bond, they correspond to three different MOL files. Each of the two Kekulé structures for the benzene ring shows up as a different set of single and double bonds (MOL I, MOL IV).

The Bond Tables are different:

The MOL file format uses the number 4 to indicate bonds that are explicitly labeled as aromatic (MOL V). This has the advantage of differentiating aromatic bonds from single and double bonds without requiring the chemist to write a script to identify and label the alternating single and double bonds of a Kekulé structure. However, some software may not be built to handle this convention. (You might even run into cases in which it’s interpreted as a quadruple bond!)
Conjugate acids and bases
Two structural formulas may represent the same compound in different conditions. (E.g. conjugate acids/bases.) Again – keep in mind that, even though these structural formulas may refer to the same compound, they will be represented by different connection tables. You may need to choose one or the other of these connection tables / structural representations – or both – depending on your aims and the conventions of the database that you’re using. (V, VI)

Resonance
Run-of-the mill delocalization presents some of the same problems as aromaticity, but there is no conventional label for (non-aromatic) delocalized electrons, such as the delocalized negative charge and pi system in benzoate (VII and VIII). The connection tables will simply represent one resonance structure or another.

Tautomerism
Connection tables don’t link together tautomers in a straightforward way. You may need to work with multiple connection tables to account for different tautomers or to make sure that you have the most appropriate one for your purposes (IX, X).

Chirality
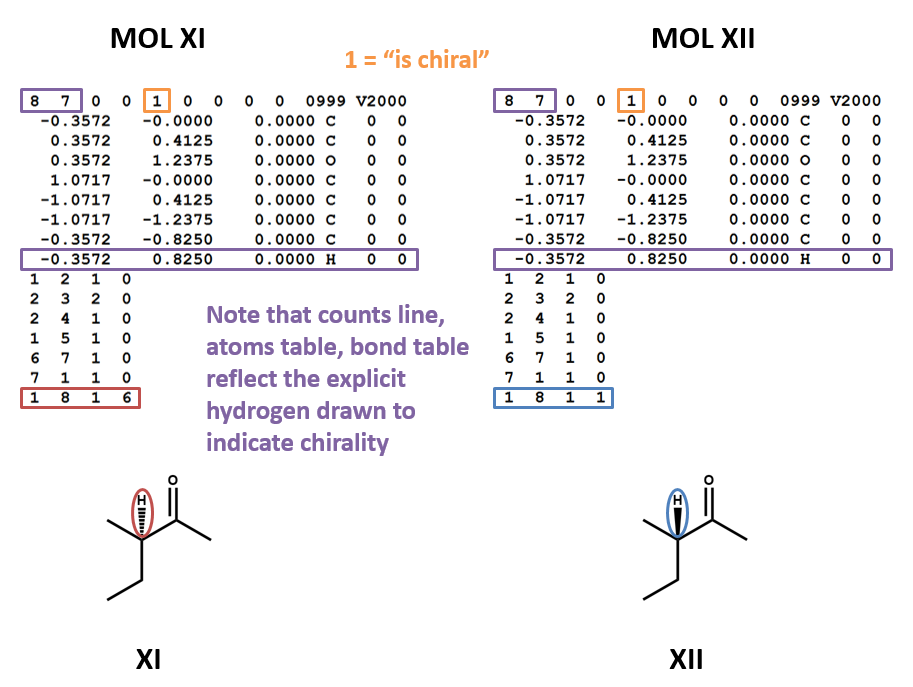
MOL files do indicate chirality. However, they can do so in two ways. A “1” or “6” in the fourth field of the bonds table indicates wedged and dashed bonds, respectively. A “1” or “2” in the stereochemistry field of the atom table represents the chirality of a stereocenter. (To make things even more complicated, software may account for the chirality of a stereocenter atom when generating a MOL file but ignore it when rendering a MOL file!) (XI, XII)
Hack-a-Mol
Here’s a website st St. Olaf College where you can play with the relationship between 2D structures, 3D renderings, identifiers, and connection tables, courtesy of the cheminformatician Bob Hanson. There’s a link on the page to a document explaining “How it Works” (also linked here). As this course proceeds you will learn how we communicate with the NCI resolver and PubChem, and many of the fundamental features behind this application.
We have also embedded Hack-a-Mol below, and when doing your assignments you may want to open in a new window.
Let’s take another look at benzoic acid. Clear the 2D sketch window using the white box button at the top, second from the left, and then draw benzoic acid. Click the right arrow button. That should render a 3D structure in the window to the right and generate a MOL file in the text window below. (For details on how where this data comes from, see “2D to 3D” and “3D to structure data” sections in “How it Works.”)
Now, take a look at the MOL file in the text window. You will note that, as a default, Hack-a-Mol includes explicit H in the MOL files it generates. (See discussion of explicit and implicit H earlier in this module for more information.)
Identify the atoms and bonds that make up the ring. (These will vary depending on the way that you drew the molecule – the 2D sketch application numbers atoms and bonds in the order that they are drawn.) Remember, the first two columns in each bond table entry refer to rows in the atom table, and the third column gives the bond type (1=single, 2=double, etc.) connecting these two atoms. (You can check yourself by hovering over atoms in the 3D window or clicking the “labels” link above this window.)
Once you have identified the six ring bonds in the MOL file, manually adjust them to generate the other Kekulé structure of the ring. (That is, switch the 1’s for 2’s and the 2’s for 1’s in the bond type fields (third column) of the bond table entries for the six ring bonds.) With the cursor still in the text window, press enter. This should generate the other Kekulé structure for benzoic acid in both the 3D and 2D windows.
Just for kicks, let’s generate a nonsense structure. Change all of the ring bonds to double bonds, and press enter. You should now have a chemically-offensive structure involving a cyclohexahexene ring with six positively charged carbon atoms violating valence rules. There’s a lesson here – software won’t tell you that your structure data is chemically nonsensical unless it is programmed to do so.
Revert to benzoic acid, either by changing the bonds back manually or just by clearing the 2D sketch window, re-drawing, and clicking the right arrow button again.
Now, let’s stick a chlorine atom onto the benzene ring. Using the atom and bond tables, locate the atom table entry for a ring hydrogen ortho, meta, or para to the carboxyl group (your pick!). Change the atom symbol in this atom table entry from H to Cl, and press enter. You should now have the chlorobenzoic acid isomer of your choice in both 3D and 2D windows.
One more exercise: let’s make our benzoic acid into pyridine-3-carboxylic acid – that is, benzoic acid with N in place of one of the ring carbons meta to the carboxylic group. This is the compound better known as niacin (vitamin B3).
(Tangential fun fact: niacin, discovered as an acidic reaction product of nicotine, was originally named nicotinic acid. In the 1930s, it was found to be the essential nutrient that prevented pellagra, a devastating disorder widely prevalent in the American South in the early twentieth century. Public health officials promoted enriching flour with nicotinic acid, and the epidemic of pellagra began to disappear. However, physicians and scientists worried that the name “nicotinic acid” gave the impression that they were curing mass disease by putting tobacco into bread. A National Research Council committee decided to change the name of the substance to niacin, short for nicotinic acid vitamin.)
Anyway: locate the entry for a ring carbon meta to the carboxyl group. (Hint: 1) use the atom and bond tables to identify the carbon atom bonded to the two oxygen atoms; 2) find the ring carbon bonded to that carboxyl carbon; 3) find a ring carbon two bonds away from that carboxyl-substituted ring carbon.) Change that carbon to N, and press enter.
Now we have the N atom in our ring, but you will notice that it’s positively charged. We didn’t change any of the explicit hydrogens, so the N atom remains protonated, like the C atom that it replaced. Let’s get rid of that hydrogen atom. Locate the entry for the N-H bond in the bond table and the entry for the corresponding H atom in the atom table, and delete both of them. Press enter.
Unless you were very lucky, you should now have a monstrous mess in the 3D window and nothing at all in the 2D window. Uh-oh. Go back to the MOL file window, press ctrl-Z twice to undo the deletion of those rows, and press enter. That will take you back to N-protonated niacin.
By deleting a row of the atom table, we renumbered all of the subsequent atom table entries. Since we didn’t change the atom references in the bond table, this broke all of the bonds to these renumbered atoms.
Once again, delete that N-H bond from the bond table and the entry for that H atom in the atom table. However, now fix the bond table references by **decreasing the atom number by 1** for all atoms below the row that you deleted. (That is, if the hydrogen that you deleted was the 13th atom table entry, change each 14 in the first two columns of the bond table to a 13, and change each 15 in the first two columns of the bond table to a 14.)
Hit enter. Ugh – your structure is probably screwed up **again**, even if you did all of this renumbering correctly. You may even have lost your ring, for some reason.
Take a look at the counts line of the MOL file – the row above the atom table, just below the file headers. The first two numbers in this line refer to the number of atoms and bonds in the molecule. Since we deleted an atom and a bond, we need to decrease each of these from 15 to 14. Do so, and then press enter again. You should now have niacin.
Whew. Thank goodness that connection table handling is so amenable to automation!
Play around some more with Hack-a-Mol. Take a look at the “How it Works” page – a lot of the notations, apps, and processes referred to on this page will be covered in subsequent weeks. You may find it useful to continue to come back to this page and play around with it as you move on in this course.
Exercises
1. Does Hack-A-Mol handle the number 4 for an aromatic bond? How can you tell? Can you create a chemically sound but non-aromatic structure using 4s in the bond field?
2. Perfluorinated octanoic acid (PFOA) is a surfactant that played a key role for a long time in the manufacture of fluorinated polymers including Teflon. Over the past decade, it has been the subject of significant public health concern and a whole bunch of litigation.
Pull PFOA into Hack-a-Mol by typing it into the text search box below the 3D window and clicking “search.”
2a. Edit the mole file to defluorinate PFOA, converting it into octanoic acid.
2b. Now make it into acetic acid. (It is possible to do this in a way that yields correct-looking 2D and 3D renderings without changing any XYZ coordinately, but you have to be ***very*** careful about how you delete and relabel atoms and bonds.)
Further Reading
- https://en.wikipedia.org/wiki/Chemical_table_file
- CTFile Formats, June 2005, Elsevier/MDL, https://web.archive.org/web/20070630061308/http://www.mdl.com/downloads/public/ctfile/ctfile.pdf (Documentation for v2000 MOL file and related chemical table file formats.)
- Hack-a-Mol: https://chemapps.stolaf.edu/jmol/jsmol/hackamol.htm
(Documentation: https://chemapps.stolaf.edu/jmol/docs/misc/hackamolworkings.pdf)
Table of Contents
- Log in to post comments
Comments 11
SCTs
Dear all,
A couple of comments on the "SCT," in response to student questions that have come up.
First, as noted above, the SCT is **not** an actual chemical structure file format. Rather, it is a simplified, bare-bones version designed to help bring out some of the general features of connection tables.
Second, SCTs are unambiguous but not canonical. That means that, while each SCT corresponds to *one* chemical structure, each chemical structure may be represented by *several* SCTs. This is because atoms may be numbered in any way you wish, and bonds may be written in any order you wish in the bonds table. There are methods for “canonicalizing” connection tables so that each chemical structure corresponds to only one connection table, using an algorithm. (The best known algorithm of this sort is called the “Morgan algorithm,” named for the CAS engineer who came up with in during the 1960s.) But this is an additional procedure applied after the connection table is formed.
The point here is that you should not assume that atoms are numbered or bonds are listed in any particular order when a connection table is created, unless you know for sure that a canonicalization algorithm has been applied.
Evan
Thank you!
Thank you so much for this clarification. You addressed some of the exact questions I had.
Human vs. connection table to MOL file
Does a human have to indicate a point of chirality or other stereospecific characteristic at some point in this process, or is the MOL file able to identify these things from the information conveyed in the connection table(s)?
Re: Human vs. connection table to MOL file
Thanks for asking - we've gotten a few questions about chirality in MOL files.
Yes, chirality can be expressed within the atom and bond tables of a MOL file, and a parsing algorithm or a visual structure editor program can render that chiral center.
Specifically, chirality can be represented in two ways. First, parity (stereocenter orientation) can be indicated by a 1 or 2 in the third field of the atom properties block (that big block of mostly zeros at the right side of the atoms table of a MOL file). This is analogous to the familiar R/S (Cahn-Ingold-Prelog) convention for indicating atom parity, although it uses a different technique that does not precisely align with R/S assignments.
Second, bond stereo orientation (wedge/dash) can be indicated by a 1 (wedge) or 6 (dash) in the four field of a bond table entry. (The figures MOL XI and MOL XII above show this technique.)
However, the fact that these two options are available can create problems that make it difficult to handle MOL file stereochemistry without bringing human judgement into play. As friend of the course Dr. Alex Clark has written, "The format has two ways to specify atom-centred tetrahedral chirality, and they are not harmonious....The relationship between wedges and parity is not well defined, and must be handled based on the circumstances. The format provides no assistance, which necessitates guesswork, and forces cheminformatics software to choose between generality and robustness, but not both."
(See for a detailed discussion of this and other pitfalls of MOL v2000 by Dr. Clark.)
Best,
Evan
Aromatic bonds - MOL file format
I was just wondering why the MOL file format uses the number 4 to indicate aromatic bonds?
Re: Aromatic bonds - MOL file format
Good question - I guess they figured that it was available, assuming that there was no need to document quadruple bonds.
This brings up a good point about the thinking underlying connection tables. While it is possible to use connection tables to represent inorganic and organometallic compounds, like most other general conventions for chemical representation, they were designed with organic compounds in mind. For 150 years or so, chemical naming, representation, and classification has been an especially pressing question in organic chemistry, since such a massive number of organic compounds are known and can be predicted, and because keeping track of all of these organics has been such an important challenge for the chemical and pharmaceutical industries.
If the MOL file had been developed with, say, transition metals in mind, perhaps the designers would have reserved the 4 in the bond order field to represent quadruple bonds. But it was developed primarily for keeping track of organic compounds. And while an organic quadruple valence bond **may** be possible, such species are not likely to be of much concern for cheminformatics.
Evan
Chirality in Mol File
I am wondering if Is there any clue on the Mol File that if the structure has more than one chirality center? Thanks
Re: Chirality in Mol File
Yep! You're correct that the "1" in the counts line at the top of the file just indicates "chiral," not the number of chiral centers. However, each specific chiral center should be indicated in the atoms and/or bonds table. Check the third column of the atom properties block (that big mess of zeros at the right side of the atoms table) for a 1 or 2 indicating the orientation of an atom that is a chiral center. Also check the fourth column of the bonds table for a 1 or 6 indicating that a particular bond is wedged or dashed.
(However, note that this stereo information may be captured in different ways, on not at all, depending on the program that created the connection table. For more details, take a look at my answer to the question "Human vs. connection table to MOL file" below.)
Best,
Evan
Conversion of molecule
I am trying to convert octanoic acid n to acetic acid in mol file. I got acetic acid in 2D structure but in 3D, it looks really bad. I am also unable to remove all other carbon and hydrogen atoms present in the octanoic acid. So can any body please help me to convert octanoic acid to acetic acid?
Thank you
Amita
Re: Conversion of molecule
Hi Amita,
This is a very tricky problem.
First, the most important thing to keep in mind is that you should never have to do conversions like this manually in your cheminformatics work (thank goodness!). The point of this exercise is to get you thinking about the kind of issues that you may have to deal with when designing or dealing with scripts that read and/or manipulate connection tables.
Second, you will have to make sure that all three parts of the MOL file are updated to reflect acetic acid:
- Counts line (see diagram of counts line above)
- Atoms table (all and only the atoms contained in acetic acid)
- Bonds table (all and only the bonds contained in acetic acid)
In doing so, you will need to **make sure that atom numbering reflects the current rows in the updated atoms table**. For instance, if you want to delete rows 6 through 10 in an atoms table but preserve the bonding pattern among the other atoms in a structure, you will need to BOTH delete the bond table entries for the atoms you've deleted AND update the numbers for other atoms in the bond table (old atom 11 becomes new atom 6, old atom 12 becomes new atom 7, etc.) The bond table cannot contain any numbers greater than the number of rows in the atoms table.
Third, take a look at the structural formula and think about what atoms you would keep, delete, and change from one element to another in order to carve an acetic acid out of the structure of octanoic acid without moving the 2D/3D position of any of the atoms. (You could also try adjusting 3D coordinates, but that makes it even tougher to create a decent-looking structure - which is about as much as you can expect from a 3D structure, when you aren't using measured or calculated 3D coordinates.)
I hope that this helps!
All best,
Evan
A couple of additional comments
Hi All,
I'd like to add a few comments which may help out, but the bottom line is play around.
First, you can go into the 2D editor and simply X out the fluorine and carbons that you do not want, then hit the right arrow, and the Jmol image and mol file become updated.
Second, if you edit the mol file, it is probably easiest to cut it into a text editor, and then paste it back. If you find you need to add an extra line, I think this is the only way, as hitting enter to create a new line updates the 2D and 3D editors. And remember, you need to change the total number of atoms and bonds, as Evan indicated above.
Third, in the 3D visualization there is a "labels" tab, which gives the atoms their number, as reflected in the atom and bond table.