Connection Tables: Background
Before we dig into how connection tables work, it’s useful to know a little bit about where they came from. An early version of the connection table was developed by the scientific information specialist Calvin Mooers as a purposefully ineffective form of chemical representation. Mooers argued that explicit tabular representations of every atom and bond in a structural formula were not very good for either machine handling (too large and difficult to parse) or communication (too difficult to read). Ironically, the development of hardware changed this calculus and the table form is quite amenable to parsing. However, it’s useful to keep in mind that from the beginning, the virtue of connection tables was not their amenability to computation or to human interpretation, but the precision and explicitness with which they expressed chemical information.
Lesson 1: Connection tables were first and foremost about expressing chemically-meaningful information as extensively and explicitly as possible, which makes them ideal for informatics and other computing purposes.
Connection tables were first put to use in information systems at DuPont in the early 1960s. DuPont had **a lot** of chemicals and chemical information to keep track of across many divisions of the company. The connection table could be encoded by clerical workers rather than trained chemists, thereby saving company resources. One worker could number atoms (arbitrarily) and write down lists of atoms and bonds, and another worker could keypunch that list onto a punched card. Unlike systematic nomenclature or line notation, connection tables could be handled by workers who had little or no chemistry training.
Lesson 2: Connection tables express a lot of chemical information, but people without a lot of chemical training (but with the help of software) can create and work with them.
Chemical Abstracts Service partnered with DuPont to develop the connection table in the mid-1960s. CAS was in the midst of developing the Registry: a computer-based index of all compounds referred to in the literature. One part of the Registry system was the Registry Number, a record number for each compound or substance reported, in any context; the other half was the connection table, a general approach to chemical structure and relationships tied to each registry number, that related all of the compounds in the Registry structurally to one another.
Lesson 3: Connection tables were originally developed for the primary purpose of recordkeeping within a very large, but contained chemical data bank.
These three lessons are useful to keep in mind as you delve into cheminformatics:
- Don’t expect connection tables to be especially elegant or compact;
- Be alert for chemically naïve uses and results;
- Watch out for divergent conventions to start popping up when you deal with connection tables outside of well-defined and curated settings.
Perhaps most importantly, connection tables represent the machine part of human-machine interactions around chemical structures. Connection tables are applied in conjunction with database ID numbers, systematic names, and line notation that are designed for managing communication with humans. In order for connection tables and these various identifiers to serve their complementary purposes as well as possible (tracking structural relationships and locating specific compounds, respectively), we need reliable interfaces to connect these two forms of chemical representation.
As a starting point, this section will introduce a simplified form of connection table, which we’ll call an “SCT”. This SCT does not correspond directly to any existing file format (at least as far as we know!). Rather, it is a convenient model that we will use just for the purpose of this demonstration.
Like most connection table formats, our SCT is made up of two tables: an atom table and a bond table.
Our atom table will consist of two fields: one an index number identifying the atom we’re talking about, one indicating atom type (i.e. C, H, O, N, etc.).
Our bond table will consist of three fields: two indicating the two atoms that the bond connects, and one indicating the bond order (1=single, 2=double, 3=triple).
As an example, take isopropyl alcohol. SCT I is a connection table representing this compound – or, more specifically, representing this structural formula.

Connection tables are not necessarily unique
We could draw up other tables of atoms and bonds that represent this compound as well: for example, SCT II and SCT III. This is an important point: connection tables are not necessarily unique. Different tables can represent the same chemical structure. (Of course, there are many situations in which it is useful to have a unique connection table for each chemical structure. There are algorithms for selecting such preferred or “canonical” connection tables.)

Connection tables may treat H implicitly or explicitly
Note that, in SCT I, only non-hydrogen atoms are specified. This follows the common practice of simply assuming that an organic compound contains as much hydrogen as the rules of valence suggest that it ought to. Sometimes, however, hydrogen atoms are explicitly included in connection tables, as in SCT IV. Many databases do not show hydrogens in the visual structures that you see, but some include explicit hydrogens in the underlying connection tables while others do not. Unfortunately, it can be difficult to determine what type of connection table is in use, and this confusion can lead to all sorts of trouble.
Imagine searching for compounds by the number of atoms that they contain. Should you look for isopropyl alcohol among those compounds containing 4 atoms (implicit H) or 12 atoms (explicit H)? You might even have to look out for compounds containing 5 atoms (explicit hydroxyl H and implicit alkyl H). Depending on how confident you are about how your data is structured, you might need to design your search to handle all of these cases. When you are setting up a connection table format, if you have th choice, it's probably smartest either to make all H explicit or to make all H implicit.

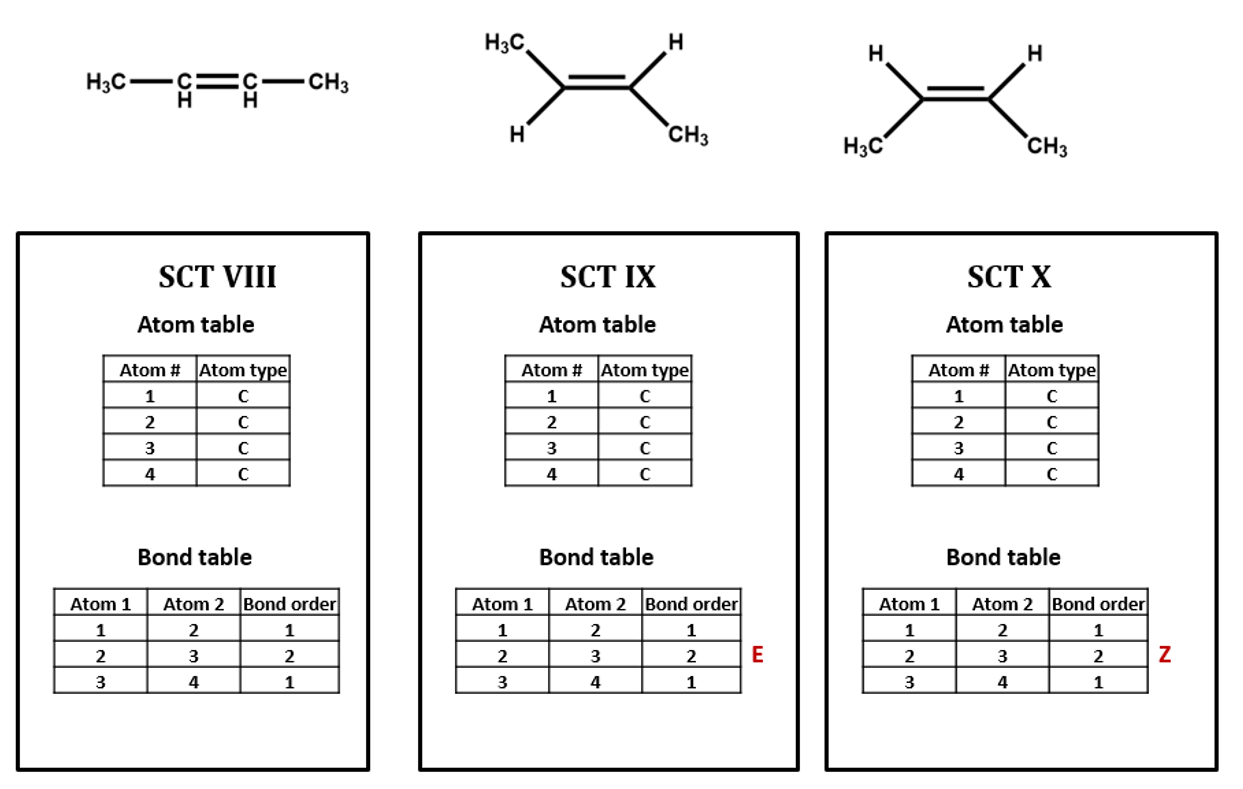
Connection tables might deal ambiguously with stereochemistry
For our next set of examples, we’ll take a look at 2-butanol. We can form its connection table in just the same way as before (SCT V). However, the substituted carbon in 2-butanol is a stereocenter. We wouldn’t know that from the plain SCT, though one could infer this using a clever algorithm based on the rules for naming R/S isomers. Even if we as human viewers recognize that the compound is chiral and can draw in a dashed or wedged bond, there is no way to represent this within the bare-bones SCT atom and bond tables. We would need to add an additional field to the atom and/or bond table to handle chirality (SCT VI, VII). We could do so either in a chemically sophisticated way, annotating the atom property, in a chemically-naive translation of a diagram feature, annotating the bond configuration, or both.

The same goes for the E/Z configuration of a carbon-carbon double-bond. (SCT VIII, IX, X)
Delocalization and other phenomena
Connection tables are built to represent compounds atom by atom and bond by bond. Higher-order structural features that affect chemical behavior and identity – especially phenomena like electron delocalization and tautomerism – can be difficult to capture. For instance, SCT XI represents the benzene ring as three single bonds and three double bonds. Of course, so does the Kekulé structure in the structural formula, but it is a challenge to find such a pattern within a table, especially since the bonds in question might not show up in consecutive order, depending on how the table is put together. Even identifying functional groups within a connection table can be a tricky proposition. We will discuss this further below and in later units of this course.

Atom coordinates
Note that the SCT atom table does not tell you anything about the relative position of atoms. (As we have seen, you often have to go to the bond table just to figure out which atom is which.)
Many connection table formats contain two- or three-dimensional spatial coordinates for each atom entry. These coordinates may simply record the relative position of atoms in a structural formula sketched in a chemical drawing program (SCT XII).

They may also represent the calculated or measured three-dimensional positions of atoms. We will address atom coordinates in connection tables in more detail below.
1. Number each of the atoms in the structural formula for benzoic acid in SCT XI.
2. Write two different valid SCTs for each of structures a) - c).

3. Draw structural formulas for the compounds represented by SCTs a) – c).

4. Write a chemically-equivalent structural formula for 2a) that results in a non-equivalent SCT. Then, write that SCT.