While this class is not a course in programming, it is useful to know what it is out there that can be used to manipulate information, perform calculations, and organize data. As this is an introduction we will just touch on three that scientists/web developers use, but there are many more - each with different advantages. This discussion does not include the hard code application development platforms like C++, C#, etc.
Desktop Application (Windows, Mac) – Microsoft Excel
A lot of people think that Microsoft Excel is really for business people and not scientists. Certainly, Microsoft caters to the business community in terms of the table formats, graphics, and cell functions. Nonetheless, Excel has functionality that can be used in the context of informatics and as you will see later in the course can talk to webservers (websites) to retrieve data.
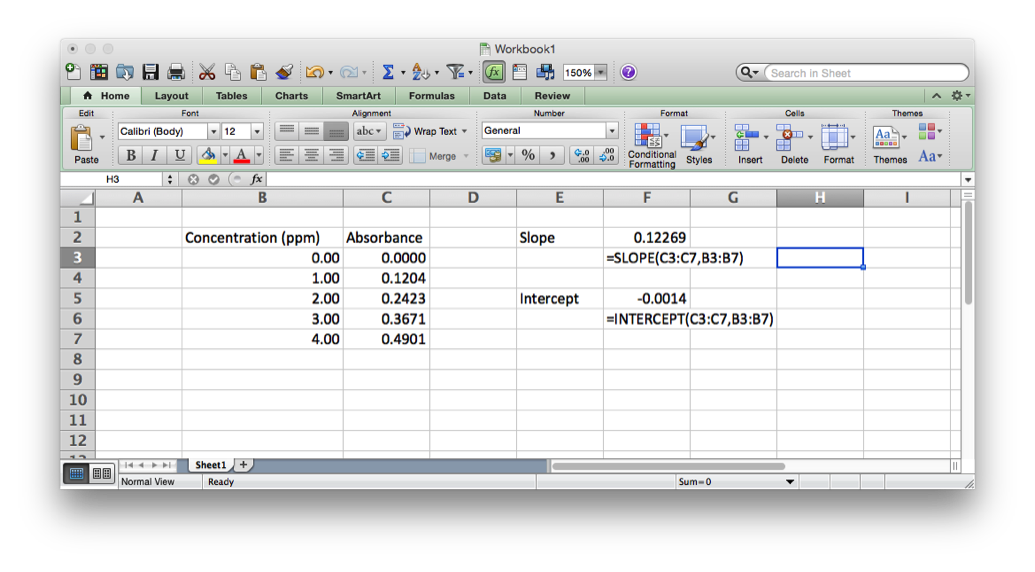
Excel has programming built-in in two ways. First, there are the in-cell functions. These are useful for text manipulation and basic math operations (see http://www.dummies.com/how-to/content/excel-formulas-and-functions-for-dummies-cheat-she.html). There are also some statistical functions like mean (AVERAGE), mode (MODE), median (MEDIAN) standard deviation (STDEV), as well as some more sophisticated functions related to linear regression (SLOPE and INTERCEPT).
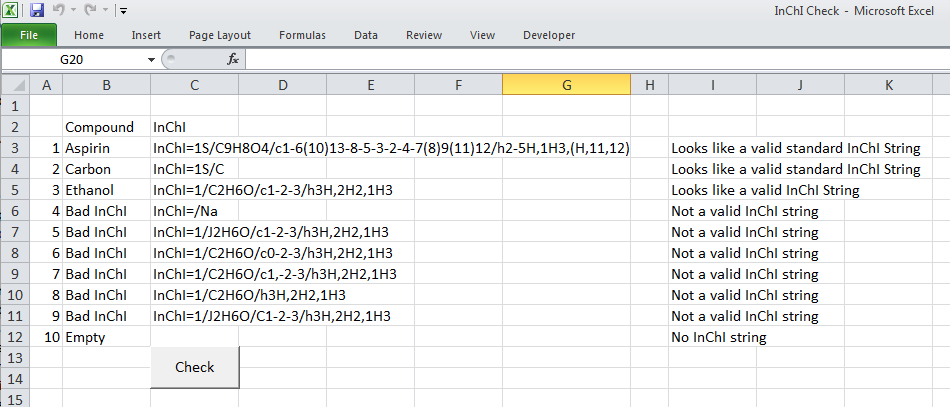
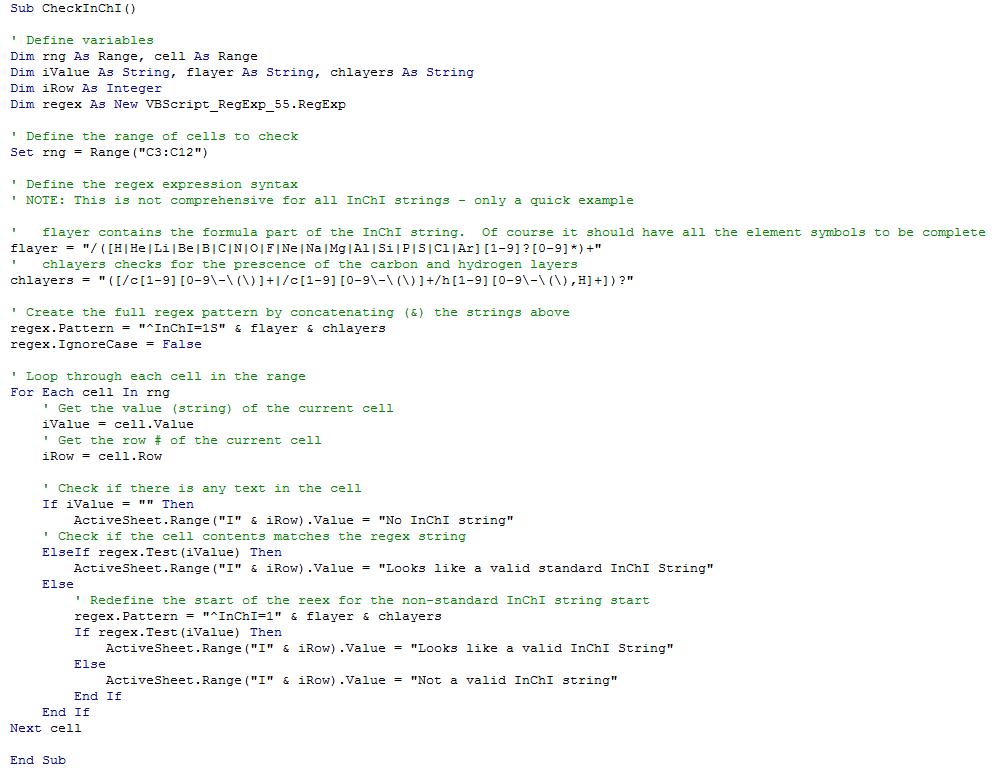
Then there is the much more sophisticated Visual Basic for Applications, (VBA), which sits behind Excel and is used to record the Macro’s run in Excel. VBA is much more a true programming language allowing for declaration of variables, loop structures, if-then-else conditionals and user defined functions. The script below is a quick example of how to check for strings to be a particular format – in this case the International Chemical Identifier, or InChI string (more later on this). This script tries to match the pattern that is defined to the text in each cell to tell if the string ‘looks’ like a valid InChI string. Whether it is would have to be tested in other ways…
Command Line Application (Any platform) – R
R (yes just the letter R) is a very popular statistical computing and graphics environment (see https://www.r-project.org/). R is sophisticated and extremely powerful so there is no way to show off its capabilities in a brief introduction but to give you a flavor here are some things you can do. R is natively a command line application, so it does not have a graphical user interface (GUI) built-in that means it launches like other applications – you run it from the command line in the terminal. There are however many GUI’s for R – for example RStudio (https://www.rstudio.com).
In order to get data into R to do something with it you must either enter it or import it from a text file. If we look back at the linear regression example from Excel we see we have two arrays of data, the x data points (concentration) and the y data points (absorbance). If we wanted to enter these into R we would do it like this.
sh-3.2# R (run R)
> xpoints <- c(0.00,1.00,2.00,3.00,4.00)
> ypoints <- c(0.0000,0.1204,0.2423,0.3671,0.4901)
> lsfit(xpoints,ypoints)
$coefficients
Intercept X
-0.00140 0.12269
$residuals
[1] 0.00140 -0.00089 -0.00168 0.00043 0.00074
…
We enter the x and y data points as matrixes (you can also think of them as arrays) and then use them as inputs to the lsfit (least squares fit) function that is defined in R. It immediately spits out the slope, intercept and residuals (the differences between the y values and the calculated y values from the equation) as well as a lot of other details not shown above.
Browser Application (Any platform) – PHP
In the early days of the Internet every webpage you accessed was static, that is, it was a page of text in a file that had to be updated manually to change it. Today, the majority of websites are built using scripts that dynamically created the page when it is requested. This is because we expect sophistication (features), information (content), and immediacy (its up to date). Therefore, the web server needs to things to create the web pages: content (typically stored in a database – see the next section) and a scripting language that can logically build the page based on a set of commands. Current the most popular language to do this is called Pre-Hypertext Processor, or PHP (see http://php.net/).
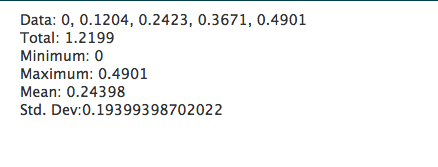
Just like R, it is impossible to show how capable PHP is in generating web pages on the fly, but a brief example script below shows how to calculate some statistics in a web page, with the output shown below it.
<?php$data = [0.0000,0.1204,0.2423,0.3671,0.4901];echo "Data: ".implode(", ",$data)."<br />";echo "Total: ".array_sum($data)."<br />";echo "Minimum: ".min($data)."<br />";echo "Maximum: ".max($data)."<br />";$mean=array_sum($data)/count($data);echo "Mean: ".$mean."<br />";$sumsquares=0;foreach($data as $point) { $sumsquares+=pow($point-$mean,2);}echo "Std. Dev: ".sqrt($sumsquares/(count($data)-1));?>
Additional Material


Comments 6
Applications
I think Excel will get you a
Excel in chemistry
MS Excel is a must, but keep its limit in mind
Excel, Google Sheets, OpenOffice/LibreOffice Calc, csv
For those coding on Macs, I